using ecological and wood property information
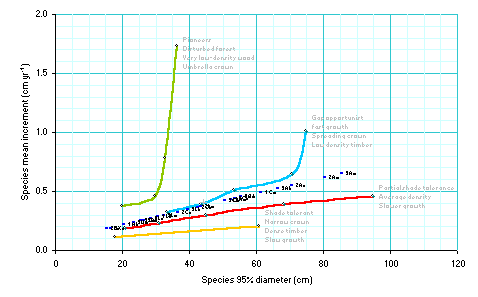
When the Tree growth module is updated from forest inventory data, initial estimates of increment will be made from a regression function, and fall on a straight line. This is shown in the {fig1} sheet of the module, as illustrated opposite.
The graph shows the species groups as points, labelled with their codes. The coloured lines link pan-tropical groups with some similar characteristics, as discussed in the Reference section. These 'metagroups' can be defined as follows:
Average growth rates lie somewhere between the red and blue lines, and this is where MYRLIN provides its first estimate.
These group positions can be adjusted manually to reflect knowledge of ecology or wood density properties. This requires as a preliminary that the formulae inserted into column E of the {table} sheet are replaced by the actual values. (How...).
On the graph it is then possible to select individual points and adjust their vertical position according to a perception of ecology, wood density, or growth rate. (How...), using as a guide the indicators in the table above.
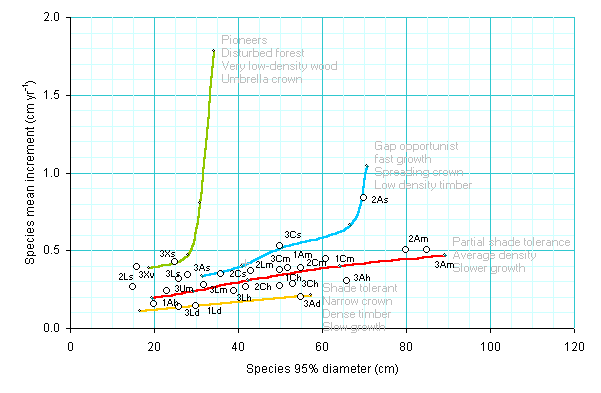
With the species groups used in this example (Review) it is possible to position the points based on the last letter. The s suffix for low density timbers probably approximates Blue line species. The m suffix for species of average density is likely to be intermediate between the Blue and Red lines. The species groups with an h suffix for moderately dense, durable timbers, have been set between the Red and Yellow metagroups. The d suffix for very dense, hard timbers has been used to move species to the Yellow line. The extreme pioneer X and v groups have been moved to the Green line. The final results are indicated in the figure above. Note that the point symbol has also been enlarged for greater clarity, and labels positioned for good results when the graph is printed.
It should also be noted that there are forbidden zones above and to the right of the metagroup to which points should not be moved (View...). Species are very unlikely to occur in these zones.
In the absence of any information about species ecology or wood density, the data points should be left unchanged from the positions initially estimated.
Once all adjustments have been made, then the model parameters can be copied or linked to the Harvesting Model.