using the mouse to select and drag them
Species group points on the graph can be moved by selecting them with the mouse. This takes a little practice. Proceed as follows:
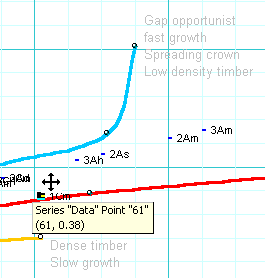
As the point is dragged up or down, the Dinc value in the {table} sheet will change to reflect the point's position. Successive points can be selected and moved in this way. Double-clicking will bring up a format dialog box for the point or series of points, and should be avoided by allowing a pause of about 1 second between successive mouse clicks.
It is also necessary to take care not to select the point label instead of the point. If the label is selected, it can also be moved, but this will not affect the Dinc value, only the appearance of the graph. When the label is selected, it becomes surrounded by a small shaded frame. The double arrow cursor will not be seen.