based on growth rate and typical size
Annual mortality rate (AMR) can be estimated from the 95% diameter and the mean increment based on two simple assumptions:
Although neither of these is likely to be true in practice for a particular tree, variability of both increment and mortality is so high that the average behaviour of increment and mortality for many species does not appear to deviate greatly from these simple assumptions.
Under the first assumption, the time taken by the tree to grow to the D95 diameter can be estimated as:
T95 = D95 / Dinc
{eqn.1}
The number of trees surviving to the D95 diameter also represents 5% of the initial population. In other words:
0.05 = (1 - AMR)T95
Substituting equation {1} for T95 and changing the above expression to give AMR on the left hand side we have:
AMR = 1 - 0.05[Dinc / D95]
{eqn.2}
Equation {2} will be found as the Excel formula in column F of the Table sheet of the MYRLIN#2 Tree Growth module. It gives an estimate of AMR once diameter increment and 95% diameter have been estimated.
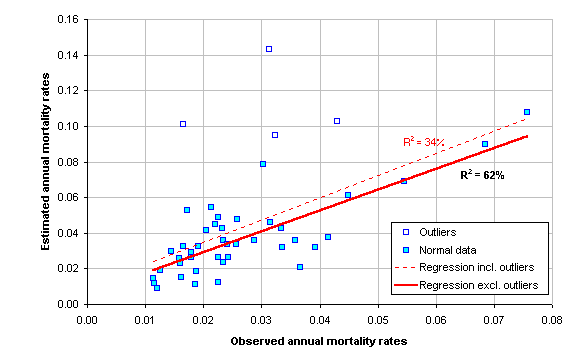
For the data from permanent sample plots, the estimated AMR using the above method can be compared with the actual AMRs observed on the plots, to give a test of the validity of the above assumptions. This is shown in figure below, using the group summaries for the data from Brazil, Costa Rica and Papua New Guinea. With all data included, the R2 is around 34%. If four outlying points are excluded, the R2 improves to 62%. On the graph, outliers are shown as empty squares, normal points have a sky blue fill; the regression for all data is shown as red . The outlying points are all for G and H groups characterised by low D95 value and high increment. For these species, it appears that the above method tends to substantially overestimate AMR compared with actual observations. It may be noted however that on the PSP data, small sizes are not implicitly included, whereas the method used above is an estimate across all sizes.
The evidence indicates that the estimates of AMR provided by the MYRLIN#2 Tree Growth tool may tend to be a little high, but are generally approximately correct. The overestimation of mortality implies that allowable cut estimates may be a little conservative, and this is probably a more desirable form of bias than one that would tend to encourage over-exploitation of the resource.