obtained from inventory data
When the MYRLIN#2 workbook module opens, three sheets will be seen, as indicated on the diagram opposite. The first of these is called {Table}. It is derived from the data in a MYRLIN#1 workbook. Selecting Alt-F8 or Tools/Macro/Macros from the Excel menu brings up the macro dialog window. Selecting and running the macro MakeD95List will update the {Table} sheet.
When the macro is run, a standard Windows Open file dialog box will appear. From this select the MYRLIN#1 workbook to be opened. If the file is already open, Excel will warn of this and will then close and re-open it. If the file opened is not properly constructed according the MYRLIN#1 format, Visual Basic error messages will result. If this appears to be happening with a file that ought to be acceptable, review the information in the stand tables section, and ensure that the MYRLIN#1 macro MakeStandTables is running within that workbook.
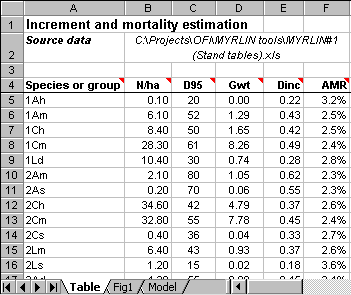
If the data file is correctly formatted, then the {Table} sheet will be updated to reflect the chosen groups. The data file name used will be shown in cells B2:F2. The columns on the worksheet above are as follows:
| Species group | Species group codes from the species list in MYRLIN#1, using the column selected on the Options sheet for that module. These groups could in fact be individual botanical species, or trade name groups, as well as more general groups. The species grouping topic gives more information about the groups shown in the example. |
| N/ha | This shows the mean number of trees per ha of the species group across all the inventory data. It is an indicator of abundance, and can be used to sort the groups to show the most important. However, N/ha is relatively strongly influenced by small trees, and Gwt (see below) may be a better indicator of importance. |
| D95 | This gives the diameter below which 95% of the trees in the group fall. 5% of the trees are larger. It is an indicator of the typical size of the species, provided that the inventory sample is broadly based (eg a regional or national inventory). This is used to provide an initial estimate of increment. |
| Gwt | This is the mean basal area in m2/ha of the trees across all inventory plots. It is closely related to volume abundance, and is a better indicator of the importance of groups than N/ha. It can be used to sort the groups so that the most abundant are seen at the top of the list. |
| Dinc | This is an estimate of the mean diameter increment of the species groups, in cm/yr. When the MakeD95List macro is run, this figure is generated from a linear regression of increment on tree size, using as data the pan-tropical group means listed on the {Model} sheet. The Reference section gives further information. |
| AMR | This is an estimate of the mean annual mortality rate, in %/yr, for the species group. It is based on the assumptions discussed in the Mortality estimation topic of the Reference section. The cell contains a formula rather than a calculated value, and care must be taken when copying and pasting to paste the value, using paste special/values, rather than an adjusted formula. |
It is important to note that when the MakeD95List macro is run, any adjustments made manually to the values in the {Table} sheet or to their sorting order will be overwritten.