Site quality and history adjustments
Modifying the tree growth rates for site history or productivity
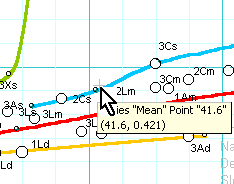 The species metagroups which are described empirically in the Reference section, and shown on {Fig1} of the Myrlin Tree growth tool, are based on relative scales for tree size and increment. These scales can be adjusted for factors that effect them. On the {fig1} sheet is a control point marked by a grey cross (see detail at right). This should be located at coordinates of about (42,0.40). This point is linked to cells G3:H3 on the {models} sheet.
Moving the control point left or right with the mouse (how...) will adjust the metagroups on the diameter axis. Moving it up or down will adjust them on the increment axis.
The data in the reference section suggests that in spite of wide variations in forest history and environments, the actual mean point for D95 and mean Dinc varies little, so large scale changes in the axes are not likely to be empirically justifiable. It is best that, unless there is clear evidence for differences from the mean values, the control point is left at (42, 0.42).
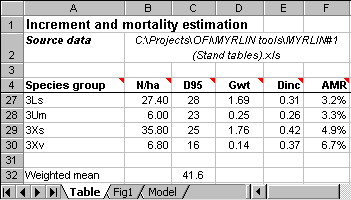
The {Table} sheet gives the calculated mean D95 for the inventory or stock survey data (see cell C32 in the example at the left). This mean value is weighted by the number of trees in each species group. It can be used to adjust the horizontal scale, either by adjusting the control point, as noted above, or by simply copying this directly onto cell H3 of the model sheet.
Direct guidance as to how the vertical scale may be adjusted for site conditions is less easy to obtain, and requires some prior increment information, preferably for several common species with known ecological/wood property attributes. These can then be placed as a series of points on the graph, and the vertical and horizontal scaling adjusted so that they occur more or less as expected in the appropriate metagroups.
In general, as the examples in the Reference section indicate, the scaling on {fig1} is robust and fairly typically representative for moist tropical forest, and should not be adjusted unless there is a clear base of evidence on which to do it.