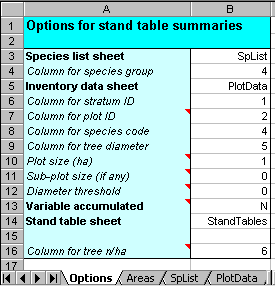
The Options tab of the Stand Tables workbook defines the sheet names and columns for the data, the sample plot design, and the variable to be tabulated.
Cell B3 gives the sheet name for the species list. Cell B4 gives the column number on the list that is used for species groups. The species groups define the rows in the stand table.
Cell B5 give the name of the sheet containing tree measurements from stock survey and/or sample plots. The subsequent cells B6:B9 give the column numbers used for stratum ID, plot ID, species code and tree diameter, respectively.
Cell B10 gives the plot size in hectares if sample plots are being used. If only stock survey data is present, it can be left blank. If a mixture of stock survey and sample plot data is used, the plot size should be filled in. For point sampling or complex plot designs not catered for by the sub-sampling option in B11:B12, -1 should be entered.
A single level of sub-sampling on the plot can be specified directly. The total sub-sample area within the plot, in hectares, should be given cell B11. The minimum measurement diameter for the main plot should be given in cell B12. For example, suppose plots are a circular, 0.1 ha design, on which trees are measured down to 20 cm dbh. One quarter of this plot comprises a sub-sample, for trees down to 5 cm dbh. In this case, the plot area is 0.1 ha (B10). The sub-sample size is 0.025 ha (B11). The threshold diameter is 20 cm. See the complex plots topic for further examples and diagrams.
The variable being accumulated in the stand table is indicated by the entry in B13. A value of N, H, or G can be used. Any other entry is equivalent to N. These codes have the following meanings:
| N | Stems numbers per km2 |
| H | Stem numbers per ha |
| G | Basal area per ha |
The name of the stand table sheet is given in cell B14. This can be changed in order to save existing stand tables with alternative options. Otherwise, when the MakeStandTables macro is run, the current stand table, as defined by cell B14, will be overwritten.
The data column indicated by B16 is only used if the plot size setting is -1, and relates to data handling for point samples and complex plot designs. For simpler cases, where B10 is empty or a positive value, it will be ignored.