Volume and allowable cut
Yield estimates from the MERLYN harvesting model
Yields over time estimated by MYRLIN#3 are shown graphed on the sheet Fig1, as for the example below. Three lines are shown:
Standing commercial volume This is shown as a green line, read from the left axis, in total m3. This is the volume above the minimum felling diameter, for the species groups indicated as commercial.
Harvested volume This is shown in red against the left axis, in m3. It shows the actual volume removed during each simulation period. In the example shown this will be 5 years.
Annual allowable cut (AAC) This is indicated by a yellow line. It is read from the right axis, and shows the harvest removed in terms of m3/ha/year.

The harvest and AAC are the same data but on different scales. To obtain AAC, the actual harvest is divided by the harvested area and the time interval for the model, to obtain a figure in m3/ha/yr.
The figures shown fluctuate from period to period because the MYRLIN#3 model controls felling on an area rather than a volume basis. Having determined the area of a periodic coupe, it will then work through the blocks in the sequence given felling this area. Because of differences in growing stock between blocks, fluctuations will occur.
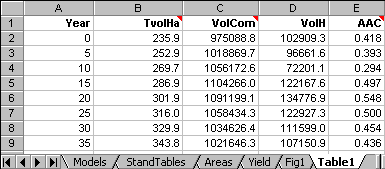 The graph lines on {Fig1} correspond to the columns on the worksheet {Table1}, part of which is shown at the right. The columns headed VolCom, VolH and AAC correspond to the standing commercial volume (green), harvested volume (red) and AAC (yellow) lines on the {fig1} sheet. The column headed TvolHa gives the total volume of all species in the model in terms of m3/ha. This is not plotted on the graph or shown as an area total as the figure is often so large relative to commercial volume that it would suppress the scale of the latter and make it unreadable.